Breakpoints and Command Catching
Overview
Breakpoints and command catching are very efficient debugging techniques. Both have the same effect: they pause the code execution (and display the debugger window if not already displayed) at a desired step.
You set breakpoints on any line of code where you want the execution to be paused. You can associate a condition to the break point.
Catching a command enables you to start tracing the execution of any process as soon as a command is called by that process.
Breakpoints
To create a break point, click in the left margin of the Source Code pane in the debugger or in the Code Editor.
In the following example, a break point (the red bullet) has been set, in the debugger, on the line If (Value type(request.reponse.headers...:
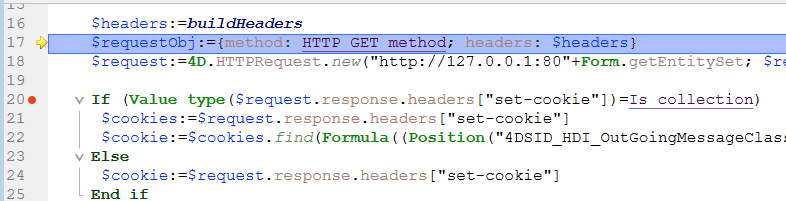
In the above example, clicking the No Trace button resumes normal execution up to the line marked with the break point. That line is not executed itself — you are taken back to trace mode. Setting a break point beyond the program counter and clicking the No Trace button allows you to skip portions of the method being traced.
To remove a break point, click the corresponding bullet.
Breakpoint Properties
You can edit the behavior of a breakpoint using the Breakpoint Properties window:

This window is available from the Code Editor or the Source Code Pane. You can:
- right-click a line and select Edit Breakpoint in the contextual menu, or
Alt+click(Windows) orOption+click(macOS) in the left margin.
If a break point already exists, the window is displayed for that break point. Otherwise, a break point is created and the window is displayed for the newly created break point.
Here is a description of the properties:
- Location: indicates the name of the method and the line number attached to the breakpoint.
- Break when following expression is true: You can create conditional breakpoints by entering a 4D formula that returns
TrueorFalse. For example, insertRecords in selection(\[aTable])=0to make sure the break occurs only if there no record selected for the table [aTable]. Breakpoint conditions are available in the Condition column of the Break list. - Number of times to skip before breaking: You can attach a breakpoint to a line located in a loop structure (While, Repeat, or For) or located in subroutine or function called from within a loop.
- Breakpoint is disabled: If you currently do not need a break point, but might need it later, you can temporarily disable it. A disabled break point appears as a dash (-) instead of a bullet (•)|
Breakpoints in remote debugging
The break point list is stored locally. In remote debugging mode, if the attached debugger is a remote 4D, the remote break point list replaces temporarily the server break point list during the debugging session.
The server break point list is automatically restored if it becomes again the attached debugger.
Break List
The Break list is a page of the Runtime Explorer that lets you manage the breakpoints created in the Debugger Window or in the Code Editor. For more information on the Runtime Explorer, see its dedicated page in the Design reference manual.
To open the Break list page:
-
From the Run menu, click Runtime Explorer...
-
Click the Break tab to display the Break list:
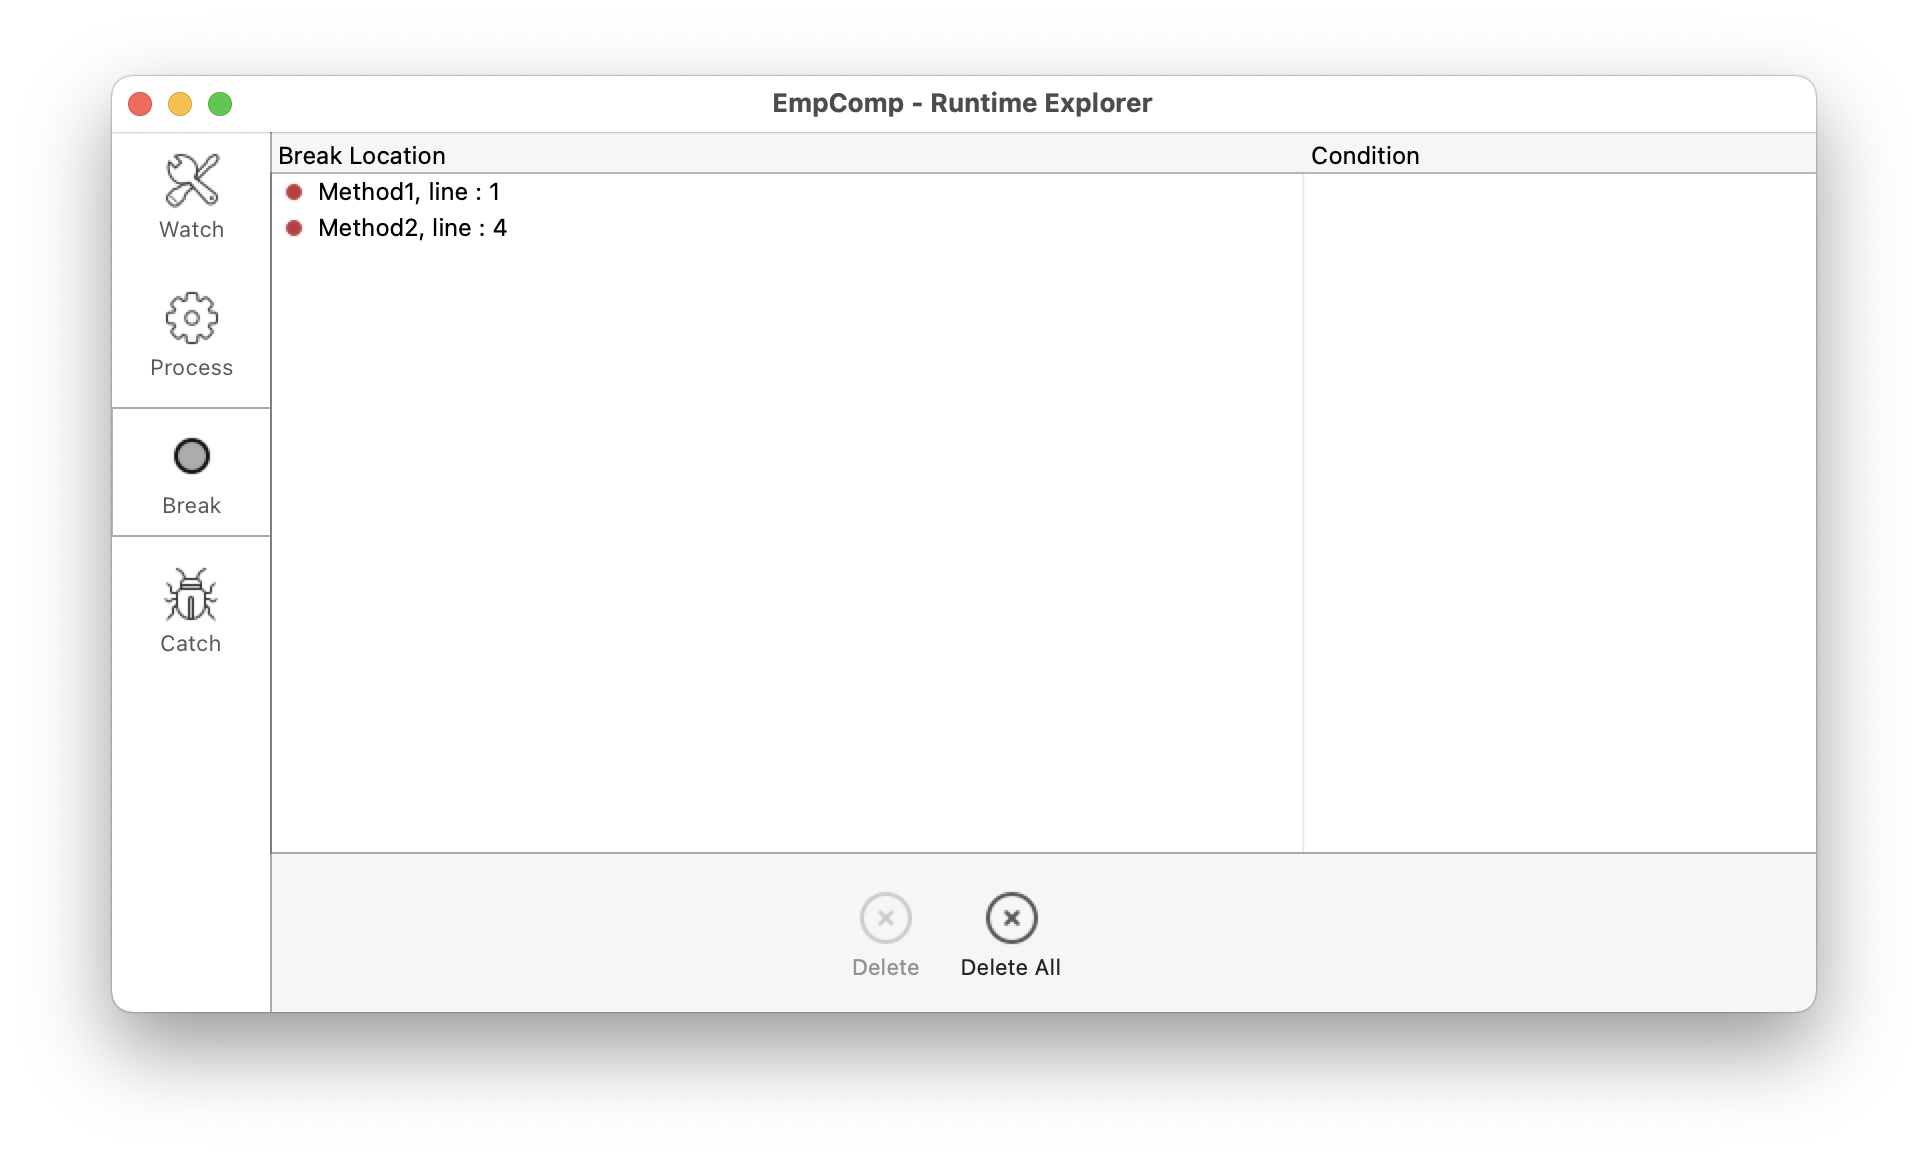
Using this window, you can:
- Set conditions for breakpoints in the Conditions column
- Enable or disable breakpoints by clicking the bullets in the margin. Disabled breakpoints display transparent bullets
- Delete breakpoints by pressing the
DeleteorBackspacekey, or click on the Delete button below the list. - Open the methods where the breakpoint are located by double-clicking any line in the list
You cannot add new breakpoints from this window. Breakpoints can only be created from within the Debugger window or the Code Editor.
Catching Commands
The Catch tab of the Runtime Explorer lets you add additional breaks to your code by catching calls to 4D commands. Unlike a break point, which is located in a particular project method (and therefore triggers a trace exception only when it is reached), the scope of catching a command includes all the processes that execute 4D code and call that command.
Catching a command is a convenient way to trace large portions of code without setting break points at arbitrary locations. For example, if a record that should not be deleted is deleted after you've executed one or several processes, you can try to reduce the field of your investigation by catching commands such as DELETE RECORD and DELETE SELECTION. Each time these commands are called, you can check if the record in question has been deleted, and thus isolate the faulty part of the code.
Feel free to combine breakpoints and command catching.
To open the Caught Commands page:
-
Choose Run > Runtime explorer... to open the Runtime Explorer.
-
Click Catch to display the Caught Commands List:
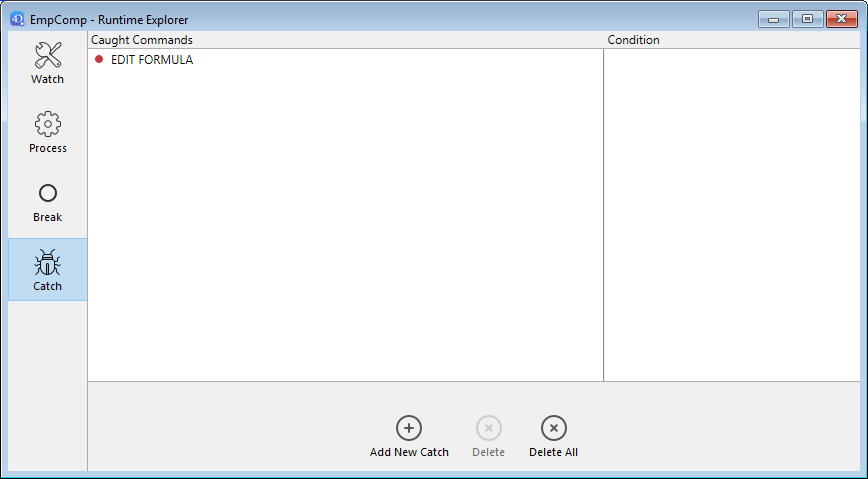
This page lists the commands to be caught during execution. It is composed of two columns:
- The left column displays the Enable/Disable status of the caught command, followed by the name of the command
- The right column displays the condition associated with the caught command, if any
To add a command to be caught:
- Click on the Add New Catch button (in the shape of a +) located below the list. A new entry is added to the list with the
ALERTcommand as default - Click the ALERT label, type the name of the command you want to catch, then press Enter.
To enable or disable a caught command, click on the bullet (•) in front of the command label. The bullet is transparent when the command is disabled.
Disabling a caught command has almost the same effect as deleting it. During execution, the debugger spends almost no time on the entry. The advantage of disabling an entry is that you do not have to recreate it when you need it again.
To delete a caught command:
- Select a command in the list.
- Press Backspace or Delete on your keyboard or click on the Delete button beneath the list (Delete All removes all commands in the list).
Setting a Condition for catching a command
- Click on the entry in the right column
- Enter a 4D formula (expression, command call or project method) that returns a Boolean value.
To remove a condition, delete its formula.
Adding conditions allows you to stop execution when the command is invoked only if the condition is met. For example, if you associate the condition Records in selection(\[Emp]>10) with the break point on the DELETE SELECTION command, the code will not be stopped during execution of the DELETE SELECTION command if the current selection of the [Emp] table only contains 9 records (or less).
Adding conditions to caught commands slows the execution, because the condition has to be evaluated each time an exception is met. On the other hand, adding conditions accelerates the debugging process, because 4D automatically skips occurrences that do not match the conditions.