Log files
4D applications can generate several log files that are useful for debugging or optimizing their execution. Logs are usually started or stopped using selectors of the SET DATABASE PARAMETER, WEB SET OPTION, or HTTP SET OPTION commands and are stored in the Logs folder of the project.
Information logged needs to be analyzed to detect and fix issues. This section provides a comprehensive description of the following log files:
- 4DRequestsLog.txt
- 4DRequestsLog_ProcessInfo.txt
- HTTPDebugLog.txt
- 4DHTTPClientLog.txt
- 4DDebugLog.txt (standard & tabular)
- 4DDiagnosticLog.txt
- 4DIMAPLog.txt
- 4DPOP3Log.txt
- 4DSMTPLog.txt
- ORDA requests log file
- 4DTCPUDPLog.txt
When a log file can be generated either on 4D Server or on the remote client, the word "Server" is added to the server-side log file name, for example "4DRequestsLogServer.txt"
Log files share some fields so that you can establish a chronology and make connections between entries while debugging:
sequence_number: this number is unique over all debug logs and is incremented for each new entry whatever the log file, so that you can know the exact sequence of the operations.connection_uuid: for any 4D process created on a 4D client that connects to a server, this connection UUID is logged on both server and client side. It allows you to easily identify the remote client that launched each process.
4DRequestsLog.txt
This log file records standard requests carried out by the 4D Server machine or the 4D remote machine that executed the command (excluding Web requests).
How to start this log:
- on the server:
SET DATABASE PARAMETER(4D Server log recording;1)
//server side
- on a client:
SET DATABASE PARAMETER(Client Log Recording;1)
//remote side
This statement also starts the 4DRequestsLog_ProcessInfo.txt log file.
Headers
This file starts with the following headers:
- Log Session Identifier
- Hostname of the server that hosts the application
- User Login Name: login on the OS of the user that ran the 4D application on the server.
Contents
For each request, the following fields are logged:
| Field name | Description |
|---|---|
| sequence_number | Unique and sequential operation number in the logging session |
| time | Date and time using ISO 8601 format: 'YYYY-MM-DDTHH:MM:SS.mmm' |
| systemid | System ID |
| component | Component signature (e.g., '4SQLS' or 'dbmg') |
| process_info_index | Corresponds to the "index" field in 4DRequestsLog_ProcessInfo.txt log, and permits linking a request to a process. |
| request | C/S or ORDA request ID or message string for SQL requests or LOG EVENT messages |
| bytes_in | Number of bytes received |
| bytes_out | Number of bytes sent |
| server_duration | exec_duration | Depends on where the log is generated: |
| write_duration | Time taken in microseconds for sending the: |
| task_kind | Preemptive or cooperative (respectively 'p' or 'c') |
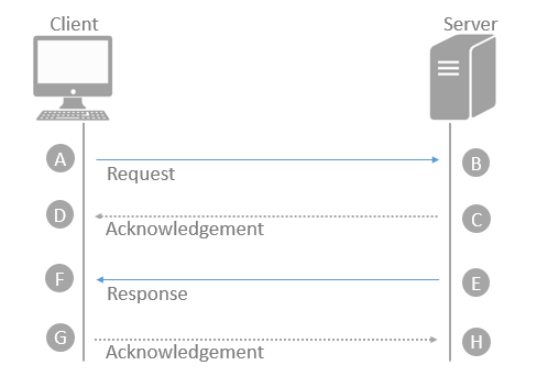
| rtt | Time estimate in microseconds for the client to send the request and the server to acknowledge it. A to D and E to H in image below. |
| extra | Additional information related to the context, for example dataclass name and/or attribute name in case of ORDA request |
Request flow:
4DRequestsLog_ProcessInfo.txt
This log file records information on each process created on the 4D Server machine or the 4D remote machine that executed the command (excluding Web requests).
How to start this log:
- on the server:
SET DATABASE PARAMETER(4D Server log recording;1) //server side
- on a client:
SET DATABASE PARAMETER(Client Log Recording;1) //remote side
This statement also starts the 4DRequestsLog.txt log file.
Headers
This file starts with the following headers:
- Log Session Identifier
- Hostname of the server that hosts the application
- User Login Name: login on the OS of the user that ran the 4D application on the server.
Contents
For each process, the following fields are logged:
| Field name | Description |
|---|---|
| sequence_number | Unique and sequential operation number in the logging session |
| time | Date and time using ISO 8601 format: "YYYY-MM-DDTHH:MM:SS.mmm" |
| process_info_index | Unique and sequential process number |
| CDB4DBaseContext | DB4D component database context UUID |
| systemid | System ID |
| server_process_id | Process ID on Server |
| remote_process_id | Process ID on Client |
| process_name | Process name |
| cID | Identifier of 4D Connection |
| uID | Identifier of 4D Client |
| IP Client | IPv4/IPv6 address |
| host_name | Client hostname |
| user_name | User Login Name on client |
| connection_uuid | UUID identifier of process connection |
| server_process_unique_id | Unique process ID on Server |
HTTPDebugLog.txt
This log file records each HTTP request and each response in raw mode. Whole requests, including headers, are logged; optionally, body parts can be logged as well.
How to start this log:
WEB SET OPTION(Web debug log;wdl enable without body)
//other values are available
The following fields are logged for both Request and Response:
| Field name | Description |
|---|---|
| SocketID | ID of socket used for communication |
| PeerIP | IPv4 address of host (client) |
| PeerPort | Port used by host (client) |
| TimeStamp | Timestamp in milliseconds (since system startup) |
| ConnectionID | Connection UUID (UUID of VTCPSocket used for communication) |
| SequenceNumber | Unique and sequential operation number in the logging session |
4DHTTPClientLog.txt
This log file records the HTTP traffic that goes through the 4D HTTP client. Whole requests and responses, including headers, are logged; optionally, body parts can be logged as well.
How to start this log:
HTTP SET OPTION(HTTP client log; HTTP enable log with all body parts)
//other values are available
The following fields are logged for both Request and Response:
| Field name | Description |
|---|---|
| SequenceID | Unique and sequential operation number in the logging session |
| ConnectionID | UUID identifier of process connection |
| LocalIP | Client IP address |
| PeerIP | Server IP address |
| TimeStamp | Timestamp (ms) at the time the request is sent or the response is fully received |
| ElapsedTimeInMs | (response only) Difference with the request timestamp |
Depending on log options, various other fields can also be logged.
- For request: request line, headers, request body
- For response: status line, headers, response body (uncompressed), if any
4DDebugLog.txt (standard)
This log file records each event occurring at the 4D programming level. Standard mode provides a basic view of events.
How to start this log:
SET DATABASE PARAMETER(Debug Log Recording;2)
//standard, all processes

SET DATABASE PARAMETER(Current process debug log recording;2)
//standard, current process only
The following fields are logged for each event:
| Column # | Description |
|---|---|
| 1 | Unique and sequential operation number in the logging session |
| 2 | Date and time in ISO 8601 format (YYYY-MM-DDThh:mm:ss.mmm) |
| 3 | Process ID (p=xx) and unique process ID (puid=xx) |
| 4 | Stack level |
| 5 | Can be Command Name/ Method Name/Message/ Task Start Stop info/Plugin Name, event or Callback/Connection UUID |
| 6 | Time taken for logging operation in milliseconds |
4DDebugLog.txt (tabular)
This log file records each event occurring at the 4D programming level in a tabbed, compact format that includes additional information (compared to the standard format).
How to start this log:
SET DATABASE PARAMETER(Debug Log Recording;2+4)
//extended tabbed format, all processes

SET DATABASE PARAMETER(Current process debug log recording;2+4)
//extended, current process only
The following fields are logged for each event:
| Column # | Field name | Description |
|---|---|---|
| 1 | sequence_number | Unique and sequential operation number in the logging session |
| 2 | time | Date and time in ISO 8601 format (YYYY-MM-DDThh:mm:ss.mmm) |
| 3 | ProcessID | Process ID |
| 4 | unique_processID | Unique process ID |
| 5 | stack_level | Stack level |
| 6 | operation_type | Log operation type. This value may be an absolute value:
operation_type, operation and operation_parameters columns have the same value as the opening stack level logged in the stack_opening_sequence_number column. For example:
|
| 7 | operation | May represent (depending on operation type): |
| 8 | operation_parameters | Parameters passed to commands, methods, or plugins |
| 9 | form_event | Form event if any; empty in other cases (suppose that column is used when code is executed in a form method or object method) |
| 10 | stack_opening_sequence_number | Only for the closing stack levels: Sequence number of the corresponding opening stack level |
| 11 | stack_level_execution_time | Only for the closing stack levels: Elapsed time in micro seconds of the current logged action; only for the closing stack levels (see 10th columns in lines 123 and 124 in the log above) |
4DDiagnosticLog.txt
This log file records many events related to the internal application operation and is human-readable. You can include custom information in this file using the LOG EVENT command.
How to start this log:
SET DATABASE PARAMETER(Diagnostic log recording;1) //start recording
The following fields are logged for each event:
| Field Name | Description |
|---|---|
| sequenceNumber | Unique and sequential operation number in the logging session |
| timestamp | Date and time in ISO 8601 format (YYYY-MM-DDThh:mm:ss.mmm) |
| loggerID | Optional |
| componentSignature | Optional - internal component signature |
| messageLevel | Trace, Debug, Info, Warning, Error, Fatal |
| message | Description of the log entry |
Depending on the event, various other fields can also be logged, such as task, socket, etc.
Diagnostic log levels
The 4DDiagnosticLog.txt file can log different levels of messages, from ERROR (most important) to TRACE (less important). By default, the INFO level is set, which means that the file will log only important events, including errors and unexpected results (see below).
You can select the level of messages using the Diagnostic log level selector of the SET DATABASE PARAMETER command, depending on your needs. When you select a level, levels above (which are more important) are implicitely selected also. The following levels are available:
| Constant | Description | When selected, includes |
|---|---|---|
Log error | A part of the application does not work | Log error |
Log warn | Potential error, use of a deprecated function, poor uses, undesirable or unexpected situation | Log error, Log warn |
Log info | Default level - Important application event | Log error, Log warn, Log info |
Log debug | Detail of application flow (for 4D technical services) | Log error, Log warn, Log info, Log debug |
Log trace | Other internal information (for 4D technical services) | Log error, Log warn, Log info, Log debug, Log trace |
Example:
SET DATABASE PARAMETER (Diagnostic log recording; 1)
SET DATABASE PARAMETER (Diagnostic log level; Log trace)
4DSMTPLog.txt, 4DPOP3Log.txt, and 4DIMAPLog.txt
These log files record each exchange between the 4D application and the mail server (SMTP, POP3, IMAP) that has been initiated by the following commands:
- SMTP - SMTP New transporter
- POP3 - POP3 New transporter
- IMAP - IMAP New transporter
The log files can be produced in two versions:
- a regular version:
- named 4DSMTPLog.txt, 4DPOP3Log.txt, or 4DIMAPLog.txt
- no attachments
- uses an automatic circular file recycling each 10 MB
- intended for usual debugging
To start this log:
SET DATABASE PARAMETER(SMTP Log;1) //start SMTP log
SET DATABASE PARAMETER(POP3 Log;1) //start POP3 log
SET DATABASE PARAMETER(IMAP Log;1) //start IMAP log
4D Server: Click on the Start Request and Debug Logs button in the Maintenance Page of the 4D Server administration window.
This log path is returned by the Get 4D file command.
- an extended version:
- attachment(s) included no automatic recycling
- custom name
- reserved for specific purposes
To start this log:
$server:=New object
...
//SMTP
$server.logFile:="MySMTPAuthLog.txt"
$transporter:=SMTP New transporter($server)

// POP3
$server.logFile:="MyPOP3AuthLog.txt"
$transporter:=POP3 New transporter($server)

//IMAP
$server.logFile:="MyIMAPAuthLog.txt"
$transporter:=IMAP New transporter($server)
Contents
For each request, the following fields are logged:
| Column # | Description |
|---|---|
| 1 | Unique and sequential operation number in the logging session |
| 2 | Date and time in RFC3339 format (yyyy-mm-ddThh:mm:ss.ms) |
| 3 | 4D Process ID |
| 4 | Unique process ID |
| 5 |
|
ORDA requests
ORDA requests logs can record each ORDA request and server response. Two ORDA requests logs are available:
- a client-side ORDA request log, in .txt format
- a server-side ORDA request log, in .jsonl format
Client-side
The client-side ORDA log records each ORDA request sent from a remote machine. You can direct log information to memory or to a .txt file on disk of the remote machine. The name and location of this log file are your choice.
How to start this log:
	//on a remote machine
SET DATABASE PARAMETER(Client Log Recording;1)
ds.startRequestLog(File("/PACKAGE/Logs/ordaLog.txt"))
	//can be also sent to memory
SET DATABASE PARAMETER(Client Log Recording;0)
Triggering the client-side 4DRequestsLog.txt using SET DATABASE PARAMETER is not mandatory. However, it is required if you want to log the unique sequenceNumber field.
The following fields are logged for each request:
| Field name | Description | Example |
|---|---|---|
| sequenceNumber | Unique and sequential operation number in the logging session | 104 |
| url | Request URL | "rest/Persons(30001)" |
| startTime | Starting date and time using ISO 8601 format | "2019-05-28T08:25:12.346Z" |
| endTime | Ending date and time using ISO 8601 format | "2019-05-28T08:25:12.371Z" |
| duration | Client processing duration in milliseconds (ms) | 25 |
| response | Server response object | {"status":200,"body":{"__entityModel":"Persons",[...]}} |
Example
Here is an example of a client-side ORDA log file record:
	{
		"sequenceNumber": 7880,
		"url": "rest/Employees/$entityset/F910C2E4A2EE6B43BBEE74A0A4F68E5A/Salary?$compute='sum'&$progress4Dinfo='D0706F1E77D4F24985BE4DDE9FFA1739'",
		"startTime": "2023-05-15T10:43:39.400Z",
		"endTime": "2023-05-15T10:43:39.419Z",
		"duration": 19,
		"response": {
			"status": 200,
			"body": 75651
		}
	}
Server-side
The server-side ORDA log records each ORDA request processed by the server, as well as the server response (optional). Log information is saved in a .jsonl file on the server machine disk (by default, ordaRequests.jsonl).
How to start this log:
	//on the server
SET DATABASE PARAMETER(4D Server log recording;1)
ds.startRequestLog(File("/PACKAGE/Logs/ordaRequests.jsonl");srl log response without body)
	//srl... parameter is optional
SET DATABASE PARAMETER(4D Server log recording;0)
Triggering the server-side 4DRequestsLog.txt using SET DATABASE PARAMETER is not mandatory. However, it is required if you want to log the unique sequenceNumber and the duration fields.
The following fields are logged for each request:
| Field name | Description | Example |
|---|---|---|
| sequenceNumber | Unique and sequential operation number in the logging session | 104 |
| url | Request URL | "rest/Persons(30001)" |
| startTime | Starting date and time using ISO 8601 format | "2019-05-28T08:25:12.346Z" |
| duration | Server processing duration in microseconds (µ) | 2500 |
| response | Server response object, can be configured in .startRequestLog() | {"status":200,"body":{"__entityModel":"Persons",[...]}} |
| ipAddress | User IP address | "192.168.1.5" |
| userName | Name of the 4D user | "henry" |
| systemUserName | Login name of the user on the machine | "hsmith" |
| machineName | Name of the user machine | "PC of Henry Smith" |
Example
Here is an example of a server-side ORDA log record:
   {
		"url": "rest/Employees/$entityset/F910C2E4A2EE6B43BBEE74A0A4F68E5A/Salary?$compute='sum'&$progress4Dinfo='D0706F1E77D4F24985BE4DDE9FFA1739'",
		"systemUserName": "Admin",
		"userName": "Designer",
		"machineName": "DESKTOP-QSK9738",
		"taskID": 5,
		"taskName": "P_1",
		"startTime": "2023-05-15T11:43:39.401",
		"response": {
			"status": 200,
			"body": 75651
		},
		"sequenceNumber": 7008,
		"duration": 240
	}
4DTCPUDPLog.txt
This log file records events related to TCP or UDP connections. Events include data transmission, errors, and connection lifecycle information. This log helps developers monitor and debug network activity within their applications.
How to start this log:
-
Use the
SET DATABASE PARAMETERcommand:SET DATABASE PARAMETER(TCPUDP log recording; 1) -
Configure the log through a JSON configuration file:
{
    "TCPUDPLogs":{
      "state" : 1
         }
}
The following fields are logged for each event:
| Field name | Type | Description |
|---|---|---|
| time | Date/Time | Date and time of the event in ISO 8601 format |
| localPort | Number | Local port used for the connection |
| peerAddress | Text | IP address of the remote peer |
| peerPort | Number | Port of the remote peer |
| protocol | Text | "TCP" or "UDP" |
| event | Text | The type of event: open, close, error, send, receive, listen |
| size | Number | The amount of data sent or received (in bytes), 0 if not applicable |
| excerpt | Number | First 10 bytes of data in hexadecimal format |
| textExcerpt | Text | First 10 bytes of data in text format |
| comment | Text | Additional information about the event, such as error details or encryption status |
Using a log configuration file
You can use a log configuration file to easily manage log recording in a production environment. This file is preconfigured by the developer. Typically, it can be sent to customers so that they just need to select it or copy it in a local folder. Once enabled, the log configuration file triggers the recording of specific logs.
How to enable the file
There are several ways to enable the log configuration file, depending on your configuration:
- 4D Server with interface: you can open the Maintenance page and click on the Load logs configuration file button, then select the file. In this case, you can use any name for the configuration file. It is immediately enabled on the server.
- an interpreted or compiled project: the file must be named
logConfig.jsonand copied in the Settings folder of the project (located at the same level as theProjectfolder). It is enabled at project startup (only on the server in client/server). - a built application: the file must be named
logConfig.jsonand copied in the following folder:- Windows:
Users\[userName]\AppData\Roaming\[application] - macOS:
/Users/[userName]/Library/ApplicationSupport/[application]
- Windows:
- all projects with a stand-alone or remote 4D: the file must be named
logConfig.jsonand copied in the following folder:- Windows:
Users\[userName]\AppData\Roaming\4D - macOS:
/Users/[userName]/Library/ApplicationSupport/4D
- Windows:
- all projects with 4D Server: the file must be named
logConfig.jsonand copied in the following folder:- Windows:
Users\[userName]\AppData\Roaming\4D Server - macOS:
/Users/[userName]/Library/ApplicationSupport/4D Server
- Windows:
If a logConfig.json file is installed in both Settings and AppData/Library folders, the Settings folder file will have priority.
JSON file description
The log configuration file is a .json file that must comply with the following json schema:
{
    "$schema": "http://json-schema.org/draft-07/schema",
    "title": "Logs Configuration File",
    "description": "A file that controls the state of different types of logs in 4D clients and servers",
    "type": "object",
    "properties": {
        "forceConfiguration": {
            "description": "Forcing the logs configuration described in the file ingoring changes coming from code or user interface",
            "type": "boolean",
            "default": true
        },
        "requestLogs": {
            "description": "Configuration for request logs",
            "type": "object",
            "properties": {
                "clientState": {
                    "description": "Enable/Disable client request logs (from 0 to N)",
                    "type": "integer",
                    "minimum": 0
                },
                "serverState": {
                    "description": "Enable/Disable server request logs (from 0 to N)",
                    "type": "integer",
                    "minimum": 0
                }
            }
        },
        "debugLogs": {
            "description": "Configuration for debug logs",
            "type": "object",
            "properties": {
                "commandList": {
                    "description": "Commands to log or not log",
                    "type": "array",
                    "items": {
                        "type": "string"
                    },
                    "minItems": 1,
                    "uniqueItems": true
                },
                "state": {
                    "description": "integer to specify type of debuglog and options",

                    "type": "integer",
                    "minimum": 0
                }
            }
        },
        "diagnosticLogs":{
            "description": "Configuration for debug logs",
            "type": "object",
            "properties": {
                "state":{
                    "description": "Enable/Disable diagnostic logs 0 or 1 (0 = do not record, 1 = record)",
                    "type": "integer",
                    "minimum": 0
                },
                "level": {
              "description": "Configure diagnostic logs",
              "type": "integer",
              "minimum": 2,
              "maximum": 6
          }
            }
          },
        "httpDebugLogs": {
            "description": "Configuration for http debug logs",
            "type": "object",
            "properties": {
                "level": {
                    "description": "Configure http request logs",
                    "type": "integer",
                    "minimum": 0,
                    "maximum": 7
                },
                "state": {
                    "description": "Enable/Disable recording of web requests",
                    "type": "integer",
                    "minimum": 0,
                    "maximum": 4
                }
            }
        },
        "HTTPClientLogs": {
		     "description": "Configuration for http client logs",
		     "type": "object",
		     "properties": {
		          "state": {
		               "description": "Configure http client logs",
		               "type": "integer",
		               "minimum": 0,
		               "maximum": 7
		          },
		     }
		},
        "POP3Logs": {
            "description": "Configuration for POP3 logs",
            "type": "object",
            "properties": {
                "state": {
                    "description": "Enable/Disable POP3 logs (from 0 to N)",
                    "type": "integer",
                    "minimum": 0
                }
            }
        },
        "SMTPLogs": {
            "description": "Configuration for SMTP logs",
            "type": "object",
            "properties": {
                "state": {
                    "description": "Enable/Disable SMTP log recording (from 0 to N)",
                    "type": "integer",
                    "minimum": 0
                }
            }
        },
        "IMAPLogs": {
            "description": "Configuration for IMAP logs",
            "type": "object",
            "properties": {
                "state": {
                    "description": "Enable/Disable IMAP log recording (from 0 to N)",
                    "type": "integer"
                }
            }
        },
        "ORDALogs": {
            "description": "Configuration for ORDA logs",
            "type": "object",
            "properties": {
                "state": {
                    "description": "Enable/Disable ORDA logs (0 or 1)",
                    "type": "integer"
                },
                "filename": {
                    "type": "string"
                }
            }
        }
    }
}
- The "state" property values are described in the corresponding commands:
[WEB SET OPTION](../commands/web-set-option) (Web log recording), [HTTP SET OPTION](../commands/http-set-option) (HTTP client log), [SET DATABASE PARAMETER](../commands/set-database-parameter) (Client Web log recording,IMAP Log`,...). - For httpDebugLogs, the "level" property corresponds to the
wdlconstant options described in theWEB SET OPTIONcommand. - For diagnosticLogs, the "level" property corresponds to the
Diagnostic log levelconstant values described in theSET DATABASE PARAMETERcommand.
Example
Here is an example of log configuration file:
{
 "forceLoggingConfiguration": false,
 "requestLogs": {
  "clientState": 1,
  "serverState": 1
 },
 "debugLogs": {
  "commandList":["322","311","112"],
        "state": 4
 },
 "diagnosticLogs":{
        "state" : 1
 },
 "httpDebugLogs": {
  "level": 5,
        "state" : 1
 },
 "POP3Logs": {
        "state" : 1
 },
 "SMTPLogs": {
        "state" : 1
 },
 "IMAPLogs": {
        "state" : 1

 },
 "ORDALogs": {
        "state" : 1,
  "filename": "ORDALog.txt"
 }
}