Debugging from remote machines
Overview
When a 4D database is running on 4D Server in interpreted mode, you can debug the 4D code running on the server from a remote 4D client logged to the project. You just need to attach the debugger to a specific remote machine, and the code execution can be monitored in the debugger directly on the remote machine.
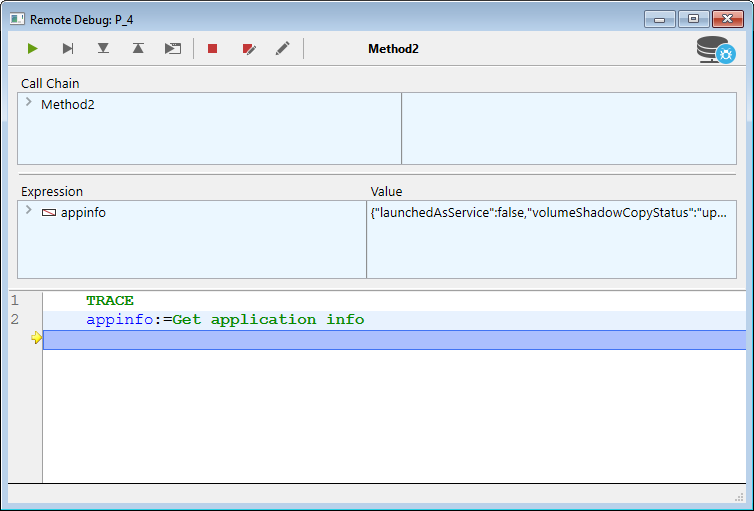
On a remote machine, the debugger window displays a specific server icon and a blue background color to indicate that you are debugging server code:
This feature is particularly useful when 4D Server runs in headless mode (see Command Line Interface), or when access to the server machine is not easy.
Attached debugger
Only one debugger can debug a 4D Server application at a given time. It is called the attached debugger. The attached debugger can be:
- the local 4D Server debugger (default) - if the server is not running headless.
- the debugger of a remote 4D client - if the remote session has access to Design mode.
The attached debugger is called whenever a 4D Server encounters:
- a break point
- a
TRACEcommand - a caught command
- an error
Keep in mind that error messages are sent to the attached debugger machine. This means that in the case of a remote debugger, server error messages are displayed on the remote 4D client.
Note that:
- The code executed in the
On Server Startup DatabaseMethod cannot be debugged remotely. It can only be debugged on the server side - If no debugger is attached, the running code is not stopped by debugging commands
Attaching the debugger
By default when you start an interpreted application:
- if 4D Server is not running headless, the debugger is attached to the server,
- if 4D Server is running headless, no debugger is attached.
You can attach the debugger to any remote 4D client allowed to connect to the 4D Server application.
The remote 4D client's user session must have access to the Design environment of the database.
To attach the debugger to a remote 4D client:
- In the 4D Server menu bar, select Edit > Detach Debugger so that the debugger becomes available to remote machines (this step is useless if the 4D Server is running headless).
- In a remote 4D client connected to the server, select Run > Attach Remote Debugger
If the attachment is accepted (see Rejected attachment requests), the menu command becomes Detach Remote Debugger.
The debugger is then attached to the remote 4D client:
- until the end of the user session
- until you select
Detach Remote Debugger
To attach the debugger back to the server:
- On the remote 4D client that has the debugger attached, select Run > Detach Remote Debugger.
- In the 4D Server menu bar, select Edit > Attach debugger.
When the debugger is attached to the server (default), all server processes are automatically executed in cooperative mode to enable debugging. This can have a significant impact on performance. When you don't need to debug on the server machine, it is recommended to detach the debugger and attach it to a remote machine if necessary.
Attaching debugger at startup
4D allows you to automatically attach the debugger to a remote 4D client or the server at startup:
- On the server (if not headless), this option is named Attach Debugger At Startup. When the server is started, it automatically attaches the debugger (default).
Warning: If this option is selected for a server which is subsequently launched in headless mode, the debugger won't be available for this server.
- On a remote 4D client, this option is named Attach Remote Debugger At Startup. When selected, the remote 4D client will automatically try to attach the remote debugger at each subsequent connection to the same 4D Server database. If the attachment is accepted (see Rejected attachment requests), the remote debugger is automatically attached to the remote 4D client and the Detach Remote Debugger option is displayed.
This setting is applied per project and is stored locally in the
.4DPreferencesfile.
Rejected attachment requests
While the debugger is already attached to a remote 4D client or to 4D Server, no other machine can attach the debugger.
If a machine tries to attach the debugger while it is already attached, the attachment is rejected and a dialog box appears:


Attaching the debugger in this case requires that:
- the attached debugger is detached from the server or from the remote 4D client using respectively the Detach debugger or Detach remote debugger menu command,
- the attached remote 4D client session is closed.