Debugging
Errors are common. It would be unusual to write a substantial number of lines of code without generating any errors. Conversely, treating and/or fixing errors is normal, too!
The 4D development environment provides several debugging tools for all types of errors.
Error types
Typing errors
Typing errors are detected by the Code Editor. They are displayed in red and additional information is provided at the bottom of the window. Here's a typing error:
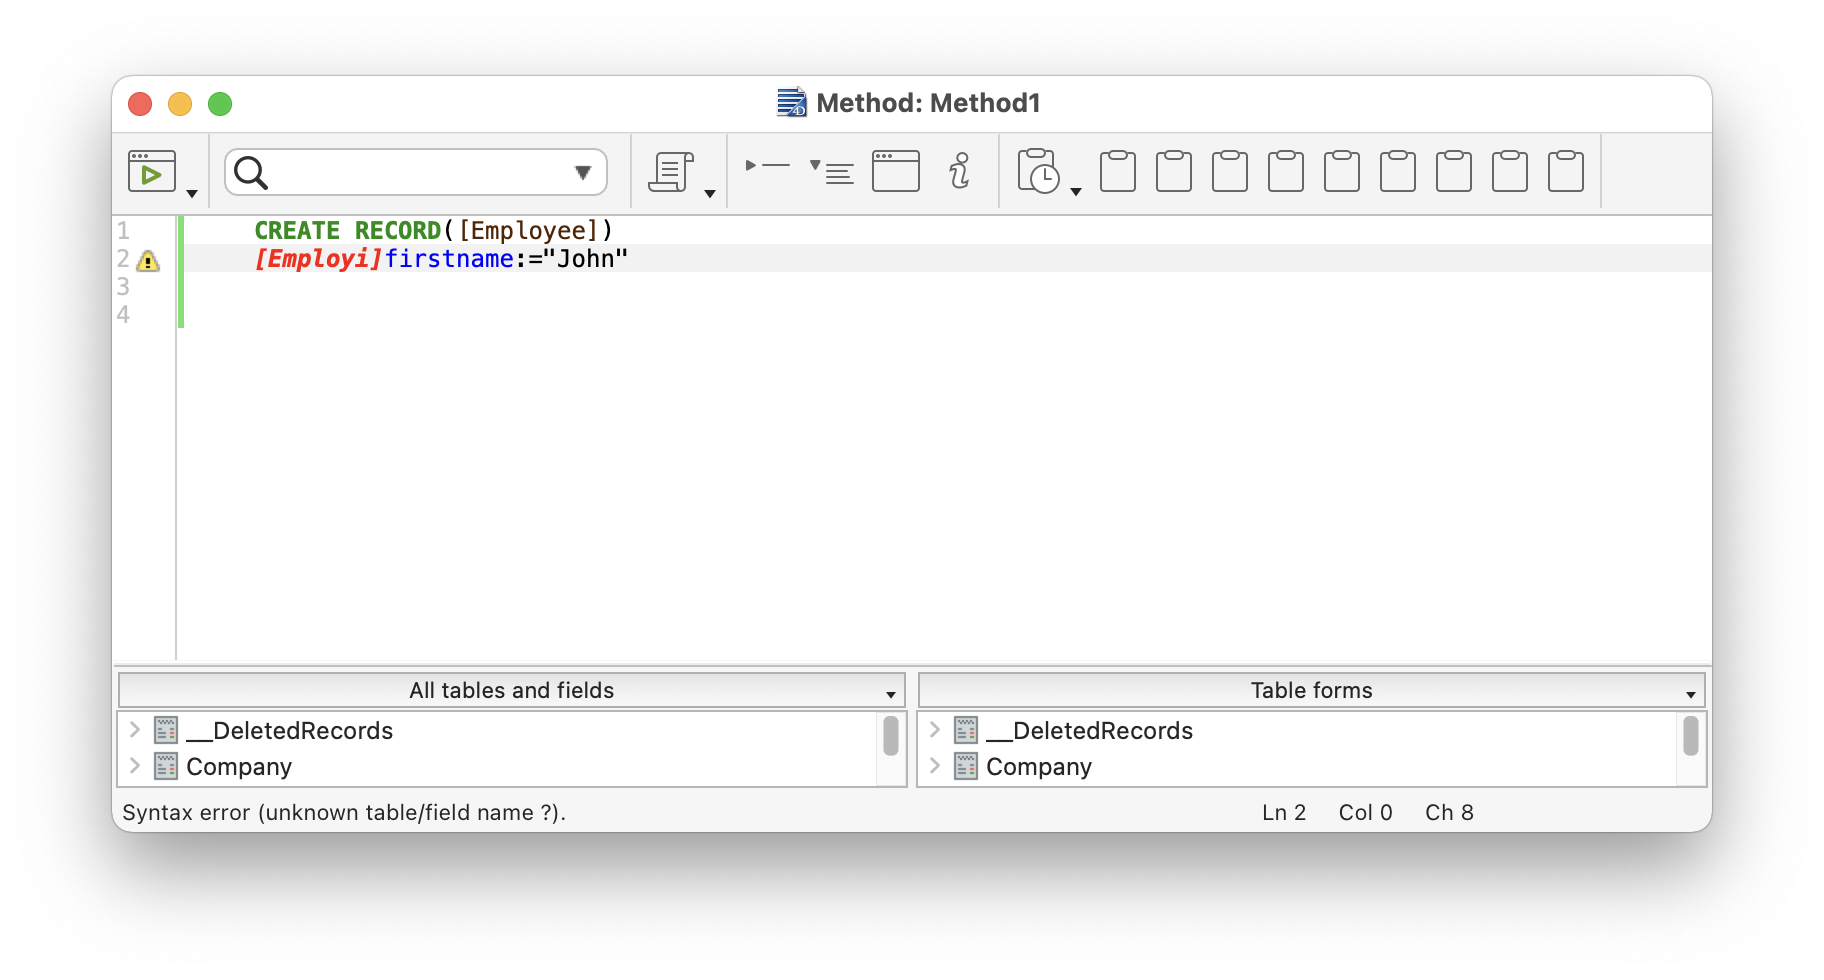
Such typing errors usually cause syntax errors (in the above image, the name of the table is unknown). You get the description of the error when you validate the line of code. When this occurs, fix the typing error and type Enter to validate the fix.
Syntax Errors
Some errors can be caught only when you execute the method. The Syntax Error Window appears when an error occurs during code execution. For example:
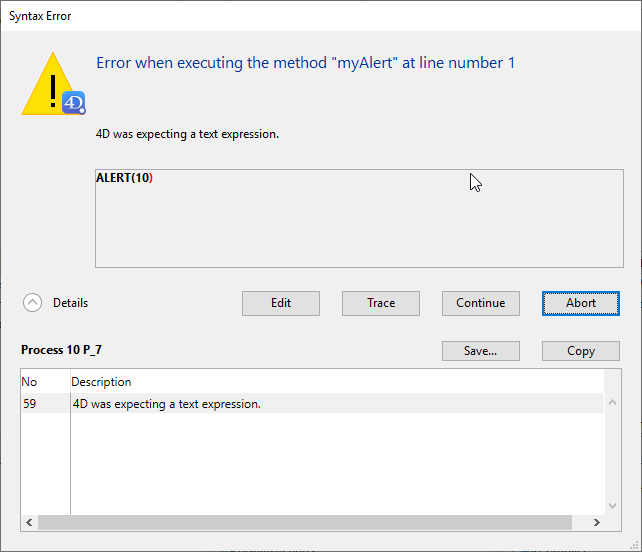
Expand the Details area to display the last error and its number.
Environmental Errors
Occasionally, there may not be enough memory to create a BLOB. Or, when you access a document on disk, the document may not exist or may already be opened by another application. These environmental errors do not directly occur because of your code or the way you wrote it. Most of the time, these errors are easy to treat with an error catching method installed using the ON ERR CALL command.
Design or Logic Errors
These are generally the most difficult type of error to find. Except for typing errors, all the error types listed above are to a certain extent covered by the expression "Design or logic error". Use the Debugger to detect them. For example:
- A syntax error may occur when you try to use a variable that is not yet initialized.
- An environmental error can occur when you try to open a document, because that document's name is received by a subroutine that did not get the right value as a parameter.
Design or logic errors also include such situations as:
- A record is not properly updated because, while calling
SAVE RECORD, you forgot to first test whether or not the record was locked. - A method does not do exactly what you expect, because the presence of an optional parameter is not tested.
Sometimes the piece of code that displays the error may be different than the code that is actually the origin of the problem.
Runtime Errors
In Application mode, you might obtain errors that you don't see in interpreted mode. Here's an example:
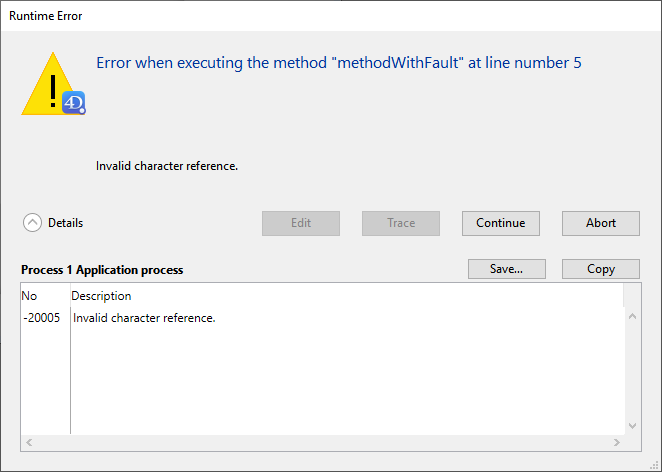
To quickly find the origin of the problem, reopen the interpreted version of the structure file, open the method and go to the corresponding line.
Syntax Error Window
The Syntax error window automatically appears when the execution of a method is interrupted. This can happen when:
- an error prevents further code execution
- the method produces a false assertion (see the
ASSERTcommand)
The upper text area displays a message describing the error. The lower text area shows the line that was executing when the error occurred; the area where the error occurred is highlighted. The expanded Details section contains the "stack" of errors related to the process.
The syntax error window proposes several options:
-
Edit: Stops all method execution. 4D switches to the Design environment and the method with the error opens in the Code Editor, allowing you to fix it. Use this option when you immediately recognize the mistake and can fix it without further investigation.
-
Trace: Enters Trace/Debugger mode. The Debugger window is displayed. If the current line has only executed partially, you may have to click the Trace button several times.
-
Continue: Execution continues. The line with the error may be partially executed, depending on where the error is located. Continue with caution: the error may prevent the rest of your method from executing properly. We recommend clicking Continue only if the error is in a trivial call (such as
SET WINDOW TITLE) that does not prevent executing and testing the rest of your code.
Tip: To ignore an error that occurs repeatedly (for example, in loops), you can turn the Continue button into an Ignore button. Hold down Alt (Windows) or Option (macOS) key and click the Continue button the first time it appears. The button label changes to Ignore if the dialog is called again for the same error.
-
Abort: Stops method execution and returns to the state before the method started executing:
- If a form method or object method is executing in response to an event, it is stopped and you return to the form.
- If the method is executing from within the Application environment, you return to that environment.
-
Copy: Copies the debugging information into the clipboard. The info describes the internal environment of the error (number, internal component, etc.). It is formatted as tabbed text.
-
Save...: Saves the contents of the syntax error window and the call chain in a
.txtfile.
Debugger
A common beginner mistake in dealing with error detection is to click Abort in the Syntax Error Window, go back to the Code Editor, and try to figure out what's going by looking at the code. Do not do that! You will save plenty of time and energy by always using the Debugger.
The Debugger allows you to step through methods slowly. It displays all the information you need in order to understand why an error occurred. Once you have this information, you know how to fix the error.
Another reason to use the Debugger is for developing code. Sometimes you may write an algorithm that is more complex than usual. Despite all feelings of accomplishment, you can't be totally sure that your coding is 100% correct. Instead of running it "blind", you can use the TRACE command at the beginning of your code, then execute it step by step to keep an eye on what happens.
Breaks
In the debugging process, you may need to skip the tracing of some parts of the code until a certain line. Or, you may want to trace the code when a given expression has a certain value (e.g. "$myVar > 1000"), or every time a specific 4D command is called.
These needs are covered by breakpoints and command catching features. They can be configured from the Code Editor, the debugger, or the Runtime Explorer.